

1. The Game of Taxes
In the Game of Taxes, you win or you die.
This is the lay of the land: Nation-states are at war with corporations, who are taking their power away. Global taxation is at the center of that fight. How nation-states manage it is a litmus test of how well they will be able to collaborate to fight their enemies in the coming decades: will all 196 of them be able to collude to fend off their rivals? Will they unite to fight the white walkers corporations? Will they have the discipline to work together? Or are they doomed?
We’ve seen a very interesting data point emerge this week.
Last Friday, about 135 countries reached a preliminary agreement to fix a floor to global corporate tax at 15%. That included Ireland. These were the stakes for the Emerald Isle:

This summer, when this was last discussed, countries like the US wanted *at least* a 15% minimum global corporate tax. But this was problematic for countries like Ireland that make a lot of tax money with lower rates than that, so Ireland didn’t join. Neither did Hungary or Estonia.
Why?

Ireland is the richest country per capita in the EU. So what would happen if Ireland lost its tax edge? It's not like it was the most productive land in the world, historically speaking . . .

Attracting so many tech firms over the past 20 years surely improved its tech sector, but there is no way Ireland would retain its GDP per capita if it lost the tax edge. At best, it would go down to the level of tech-savvy Sweden. That would be a loss of 30% of Irish GDP . . .
For these reasons, I was doubtful that Ireland would accept the 15% deal. But they did. It means some of my assumptions were wrong. Here are my hypotheses:
Ireland’s cost of opportunity was higher than I thought (i.e., the penalty of not signing the deal would be higher than that of signing it)
The pain of signing the deal was lower than I thought
So which one is it? Why did they accept the deal?
Leprechaun Economics
Maybe Ireland doesn't care as much about losing GDP per capita, because most of that wealth has remained in the pockets of those who were only attracted to Ireland because of taxes in the 1st place?

One of the reasons is that taxes distort Ireland's GDP so much that they had to come up with a different measure from GDP, the Modified Gross National Income.
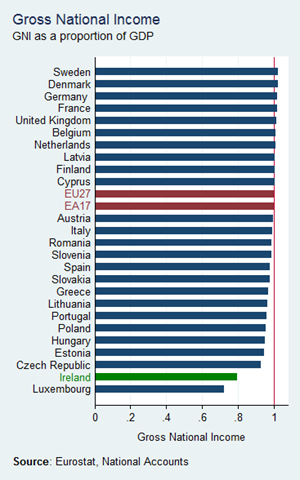
The distortions introduced by foreign companies were so egregious that, in 2015, the Irish GDP grew by 25%! The country tried to hide the rationale, but it eventually became public.

Q1-2015 is the Apple effect.
Economics Nobel Prize winner Paul Krugman called this Leprechaun Economics: it turns out that Apple made a fiscal move that single-handedly caused the jump in GDP!
This, obviously, has no impact whatsoever on the lives of most Irish people—and neither do the moves of other big multinationals—so GDP per capita is not a good measure of anything in Ireland.
Still, that's a lot of income that wouldn’t be taxed with a new corporate tax floor that’s at least 15%, no?
Maybe not.
Ireland’s tax rate is already 12.5%, so it’s not too far from 15%. With Ireland’s pressure, the language of the agreement was changed from “at least 15%” to “15%”, which means the country’s risk is mitigated.
Not only that, but companies with revenue below $750M are not affected. That’s quite a high threshold. So this will mostly affect huge companies like Apple or Facebook.
Even then, that’s the top line tax rate. What matters is the effective tax rate, what companies really pay. And there’s a very large gap between official and effective tax rates.

The real tax rate that companies pay is actually well below 12.5%!
Companies achieve that through mechanisms called Base Erosion and Profit Shifting (BEPS). Feel free to click on that link to fall through the rabbit hole of big corporation tax avoidance.
What’s the takeaway?
I had two hypotheses on why Ireland accepted the agreement: either the consequences of not signing would be too bad, or signing it was actually not too problematic.
I’m not sure what leverage bigger companies have on Ireland, but what’s clear is the pain of signing the agreement is much lower than I thought: it won’t affect the average Irish person beyond less taxes for the government, and even then, it’s unclear how much that will be impacted since the effective rate is so much lower than the official rate.
The relevant question becomes: how much will corporations be able to keep using BEPS to bring down their effective tax rate with the new global tax rate floor? I have no idea. But I’m sure there are plenty of lawyers already signing deals worth millions of dollars to figure this out.
There are still only ~135 countries out of 196 who have signed this agreement, but still. All of this tells us that nation-states have some ability to collude to fend off rivals, at least on paper. Let’s see if they can do it in practice or if corporations will figure out a way to get around these rules.
Like they always do.
2. Inequality
Nuancing GDP per Capita vs. Inequality
“All models are wrong. Some are useful.” — George Box.
In this week’s article, 'Playing Catch-Up with the US,' I used average real GDP per capita. Some people disagreed with my choice of using average (instead of median) and real (instead of purchasing-power parity). Their concern was that these measures don’t reflect the true perception of wealth of a country’s citizens.
They’re right.
Averages weigh all elements of a group, whereas medians focus on the elements in the middle. You could have a country with 999 people having nothing and one person having $1 million, and the average would still be $1,000 per person, but the median would be $0.
So if you want to pay attention to the experience of wealth of the average person, the median is the way to go.
Purchasing-power parity (PPP) is also a better measure of people’s perception of wealth, because they take into consideration the cost of things. A person making $1,000 per month will feel dirt poor in New York but will feel like a queen in Malawi.
So when I go on to talk about inequality, I will definitely use medians and PPPs. This is not what the article I wrote earlier this week was about.
That article was about measuring the potential development of different countries; the wealth they can generate. That potential has two weird properties that make it very useful: it’s been growing for 150 years at an astonishingly stable rate, and you can use the US’ as a max to compare other countries to. That’s it. It was not a judgment of whether the rest of the world should follow the US’ growth path, or whether it was good for the world to do so1.
Real average GDP per capita is not a perfect metric. But it’s the most adapted to the insight I wanted to highlight.
My Current Position on Inequality
That’s not to say that inequality is unimportant. It’s very, very important. It’s been growing dramatically since the 1970s, it’s reaching a level that mankind has never seen, and I fear it will continue that way.
I say fear, because I believe humans are unhappy when inequality is too high. All other things being equal, a more equal society is a happier society.
Unfortunately, all other things are not equal. The relationship between wealth generation and inequality is complicated. What is true, however, is that to redistribute wealth you first need to create it. So wealth generation and inequality can be analyzed separately, but they must eventually be considered in tandem.
Soon I’m going to publish an article on the impact of automation on inequality. The follow-ups to The End of Nation-States will touch on inequality too. So look out for them, and reach out if you have some strong opinions/insights to share. In the meantime, here’s my current position on inequality, which I’m sure will evolve as I learn more:
Inequality has shrunk over time, both globally and in consumption.
There’s a lot of hypocrisy around inequality.
• Inequality is conceptually good.
• It’s not a question of whether inequality is good or bad. It’s a question of how much is best. Too much inequality is very bad. It makes communities unhappy.
• The problem today is specifically the vast concentration of wealth in the hands of self-made wealth producers of the late-20th and 21st century.
• Many of these—but not all—come from internet-based network effects. There will probably be many more.
• At our current trajectory, we will soon reach the point of having the most inequality the world has ever seen.
• Historically, wealth inequality constantly rises, and it has only been reduced by events that are generally not desirable: wars, revolutions, state disintegrations, and epidemics.
• The main reason why people fear inequality today is because they can discern in the fog of the future a world where they don’t have a job but a few people concentrate vast amounts of wealth. In other words, it’s less about jealousy and more about survival fears.
• For structural reasons, the government is a terrible capital allocator.
All of the above leads to the key questions:
§ What’s the right level of inequality to optimize world happiness?
§ What are the best mechanisms to achieve it in a world where technology inherently leads to inequality?
Please let me know in the comments which statements feel the most interesting and/or controversial.
3. China’s Growth Story Is Nothing Special
Perhaps my most contentious argument in this week’s article was that there was nothing special about China’s growth except the fact that the country has 1.4B people.
I reckon the biggest disagreement was rooted in the fact that China has lifted 800M people out of poverty extra fast, in a matter of just 4 decades, to become the biggest country in PPP GDP in the world, and it's about to surpass the US, all while showing that an alternative system to the US’ is possible. Surely that must mean China is indeed exceptional.
I believe most of these facts are true, but I don’t think they lead to that conclusion. I still think China is average apart from its size.
Let’s look into it.

The first thing to highlight is that China was dirt poor until the end of the 1970s. That, of course, is Mao’s influence, showing that true communism was catastrophic for wealth generation.
By the time Deng Xiaoping took power, Japan, Taiwan, South Korea, Malaysia, Thailand, Indonesia, and the Philippines were richer per capita.
Taiwan is an especially good comparison, because it has the exact same culture as Mainland China. The only differences are a physical disadvantage (much smaller, very mountainous, so less fertile lands) and a different economic system. And yet by the end of the Mao period, Taiwan was 4x richer per capita! Today it’s… still 3.4 times richer!
Once China shed its communism and became a capitalist autocracy, it started growing. But that was just normal catch up! Japan, Taiwan, South Korea, Malaysia, Thailand… All are East and South East Asian countries that are still richer than China.
Sure, China has been growing faster than them over the last few decades, but that’s exactly what you’d expect from a country that started growing later and from a lower base.
Looking at this graph, it’s very hard to say that the Chinese system is a viable alternative. It would if it grew to a level closer to Japan, South Korea, or Taiwan. But it’s not a coincidence that the most liberal countries in East Asia are also the richest.
Interestingly, since Xi Jinping — arguably the most authoritarian president China has had since Mao — became president, growth has stalled.
So yes: it’s beautiful that 800 million Chinese are lifted out of poverty. There are nothing but good things to say about that. It’s one of the best things that has happened in history to maximize the happiness of the world.
But we need to get the causality right. Is that thanks to the Chinese government, or despite the government? If it had a more liberal approach, wouldn’t it have grown faster? You can see China’s growth not as a miracle lifting 800M people out of poverty in 4 decades, but rather keeping them in poverty for decades while their neighbors were enjoying unprecedented wealth.
4. Why Is the US GDP So Stable?
This is a question that Patrick Collison, CEO of Stripe, asked a few years back.

As you know, GDP can be divided into (1) population and (2) their productivity — which can be approximated by GDP per capita.
We’ve already seen how stable GDP per capita has been:

If the population also grew at a stable rate, you’d then have smooth GDP growth. Population, indeed, has grown extremely smoothly.

The massive amount of immigration into the US made it surpass in population all the other industrialized countries of the time. The current growth trend has been constant since the turn of the 20th century.
With stable people growth and stable GDP/person growth, you get stable GDP growth. The next question is why GDP/person has been so eerily stable.
The Drivers of GDP per Capita
In antiquity, the Strait of Gibraltar between the Mediterranean and the Atlantic was named the Pillars of Hercules. Nobody should venture beyond, because there was nothing further beyond, or in Latin, Non Plus Ultra.
Of course, there was something beyond—America. So when a country decided to stop paying attention to that sentence, it found America and its riches. That was Spain, whose motto, to this day, is Plus Ultra. Further Beyond.
As we saw in the free article this week, the Non Plus Ultra of GDP today is the United States of America.

And it comes from this very consistent annual growth of 1.7%, which started about 200 years ago, and hasn’t stopped since.

Even before the Industrial Revolution, US GDP per capita was already growing at a healthy clip of ~0.7% per year.
The question for today is why.
Whenever a problem is too big, the way to solve it is to break it down, ideally in a MECE way. So what produces GDP per capita? The way it’s calculated is GDP divided by population, so that’s not helpful.2
Instead, economists calculate GDP per capita as the result of:
• Labor
• Capital
• Productivity
Labor is how many workers you have and how many hours they work.
Capital is accumulated wealth, which depends on how much wealth is added every year (savings rate) and how much is destroyed (depreciation rate).
Productivity — which is called Total Factor Productivity — is everything else: how good people are at producing wealth based on the work and capital they have.
Labor
Labor is just the population times the share of that population that works, times the number of hours worked per person.
We’ve already seen the population is pretty stable. What about the other two?
The workers/population is called labor force participation rate:

I couldn’t find data going back to the 19th century, but we can see that, even in the massive shift of the arrival of women into the workforce, the share of the population that had a paid job barely moved from 60% around 1950 to 67%, and is now back to ~63%. It’s unlikely that this has changed dramatically since the 1800s.
Hours worked per worker have gone down by nearly 50%!

Source.
The combination of these factors means that labor per capita has been going down over time in the US—and the developed world—not up.
Which means the growth in GDP per capita was either from capital or from productivity.
Capital
Capital accumulates when people can save a lot, and is depleted when it depreciates. That would mean that a society that can save a lot and for which assets don’t depreciate is going to accumulate lots of capital.
We are indeed seeing this. It’s at the root of today’s inequality.

Capital increases the production of a country, but only up to a certain point. If more capital is available, it chases a set number of opportunities defined by the number of workers and their productivity, and can’t increase production any further. We’re seeing this today: there’s more money than ever before, but interest rates are also extremely low.
The issue is diminishing marginal returns. Assume a Minecraft economy with a bunch of people punching trees to collect wood. That gets you an amount of wood per year. Next, the technology of axe-making is introduced. Now some wood can be made into wood axes. This increases the amount of wood that is chopped every year, and the number of axes being used until one hits the labour constraint (there are only so many people that can wield the axes). Even with an exponentially increasing population, the extra benefits of the axe is a one off thing. This illustrates that accumulating capital gets you some initial growth, and then no more. To get continued economic growth you need productivity. — 'On the constancy of the rate of GDP growth,' Nintil, Jose-Luis Rincon Fernandez de la Fuente.
And regardless, you can’t increase by orders of magnitude the savings rate or the depreciation rate, so that can’t be the root of the growth of GDP per capita in orders of magnitude.
So all of the above boils down to this: GDP per capita grows because people are more productive all the time. Economists call that Total Factor Productivity.
Productivity
At the end of the day, GDP grows because people improve. Whenever you find something that you can do better than those who came before you, you are increasing productivity. It’s this accumulation of knowledge that increases productivity over time.
It doesn’t increase in a smooth way though.
I’m going to focus on the US here because, as I explained, the US is the forerunner of economic development. The growth of other countries is either a similar mechanism (usually less than the US), or a catch-up factor with the US.
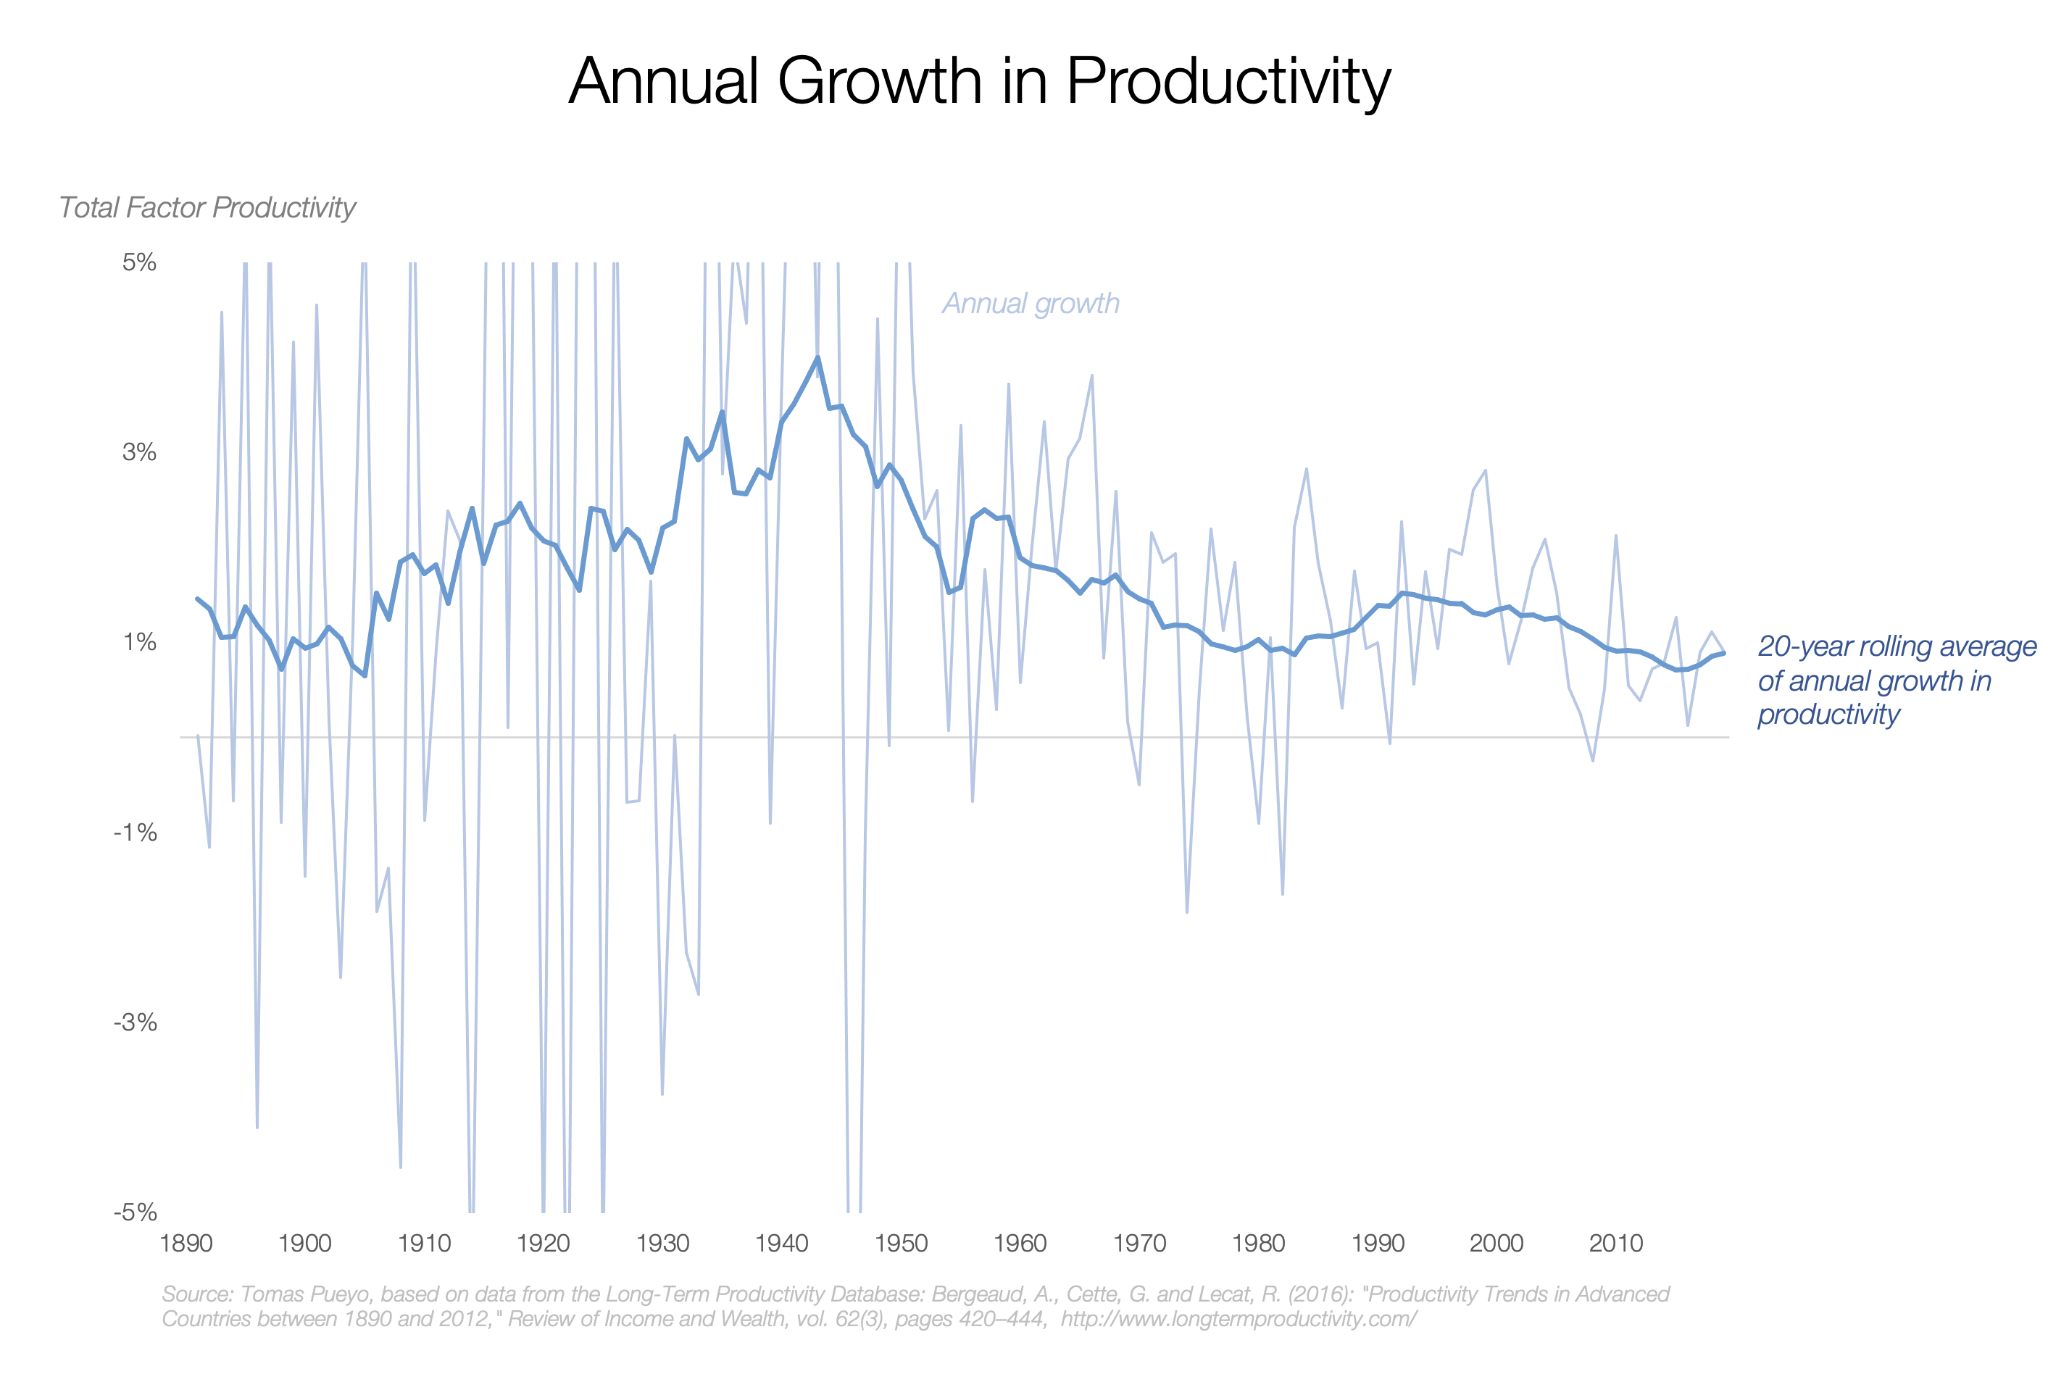
As you can see, annual growth in productivity changes a lot. Even if the average from 1880 to today is ~1.7%, annual growth has gone from -10% in the worst years to +13% in the best.
We can see two interesting patterns here:
• There was a “mountain” of growth in the first half of the 20th century, which has gone down in the 2nd half.
• Annual growth in productivity is much more stable now. Since 1970, US productivity has grown between -1% and 3% most years. Since the mid-80s, the worst year in US productivity growth was 2008, at just -0.2%.
What might cause these two things to happen at the same time: lower average growth and lower variance? There’s very little agreement among scholars on all of this, so I enter into speculative territory here and I won’t pretend to have all the answers. But let’s examine the most interesting explanations I’ve found so far.
Why there was a Mountain of Productivity Growth in the Past
The amazing Jose-Luis Rincon Fernandez de la Fuente, author of Nintil, has an amazing couple of posts (1 & 2) about this.3
His argument is that every industry tends to improve its productivity rather slowly, except within periods of huge productivity growth. It’s the combination of these growth peaks that creates the overall productivity growth of the economy.
Here are a few examples from his articles:

The same is true for light.
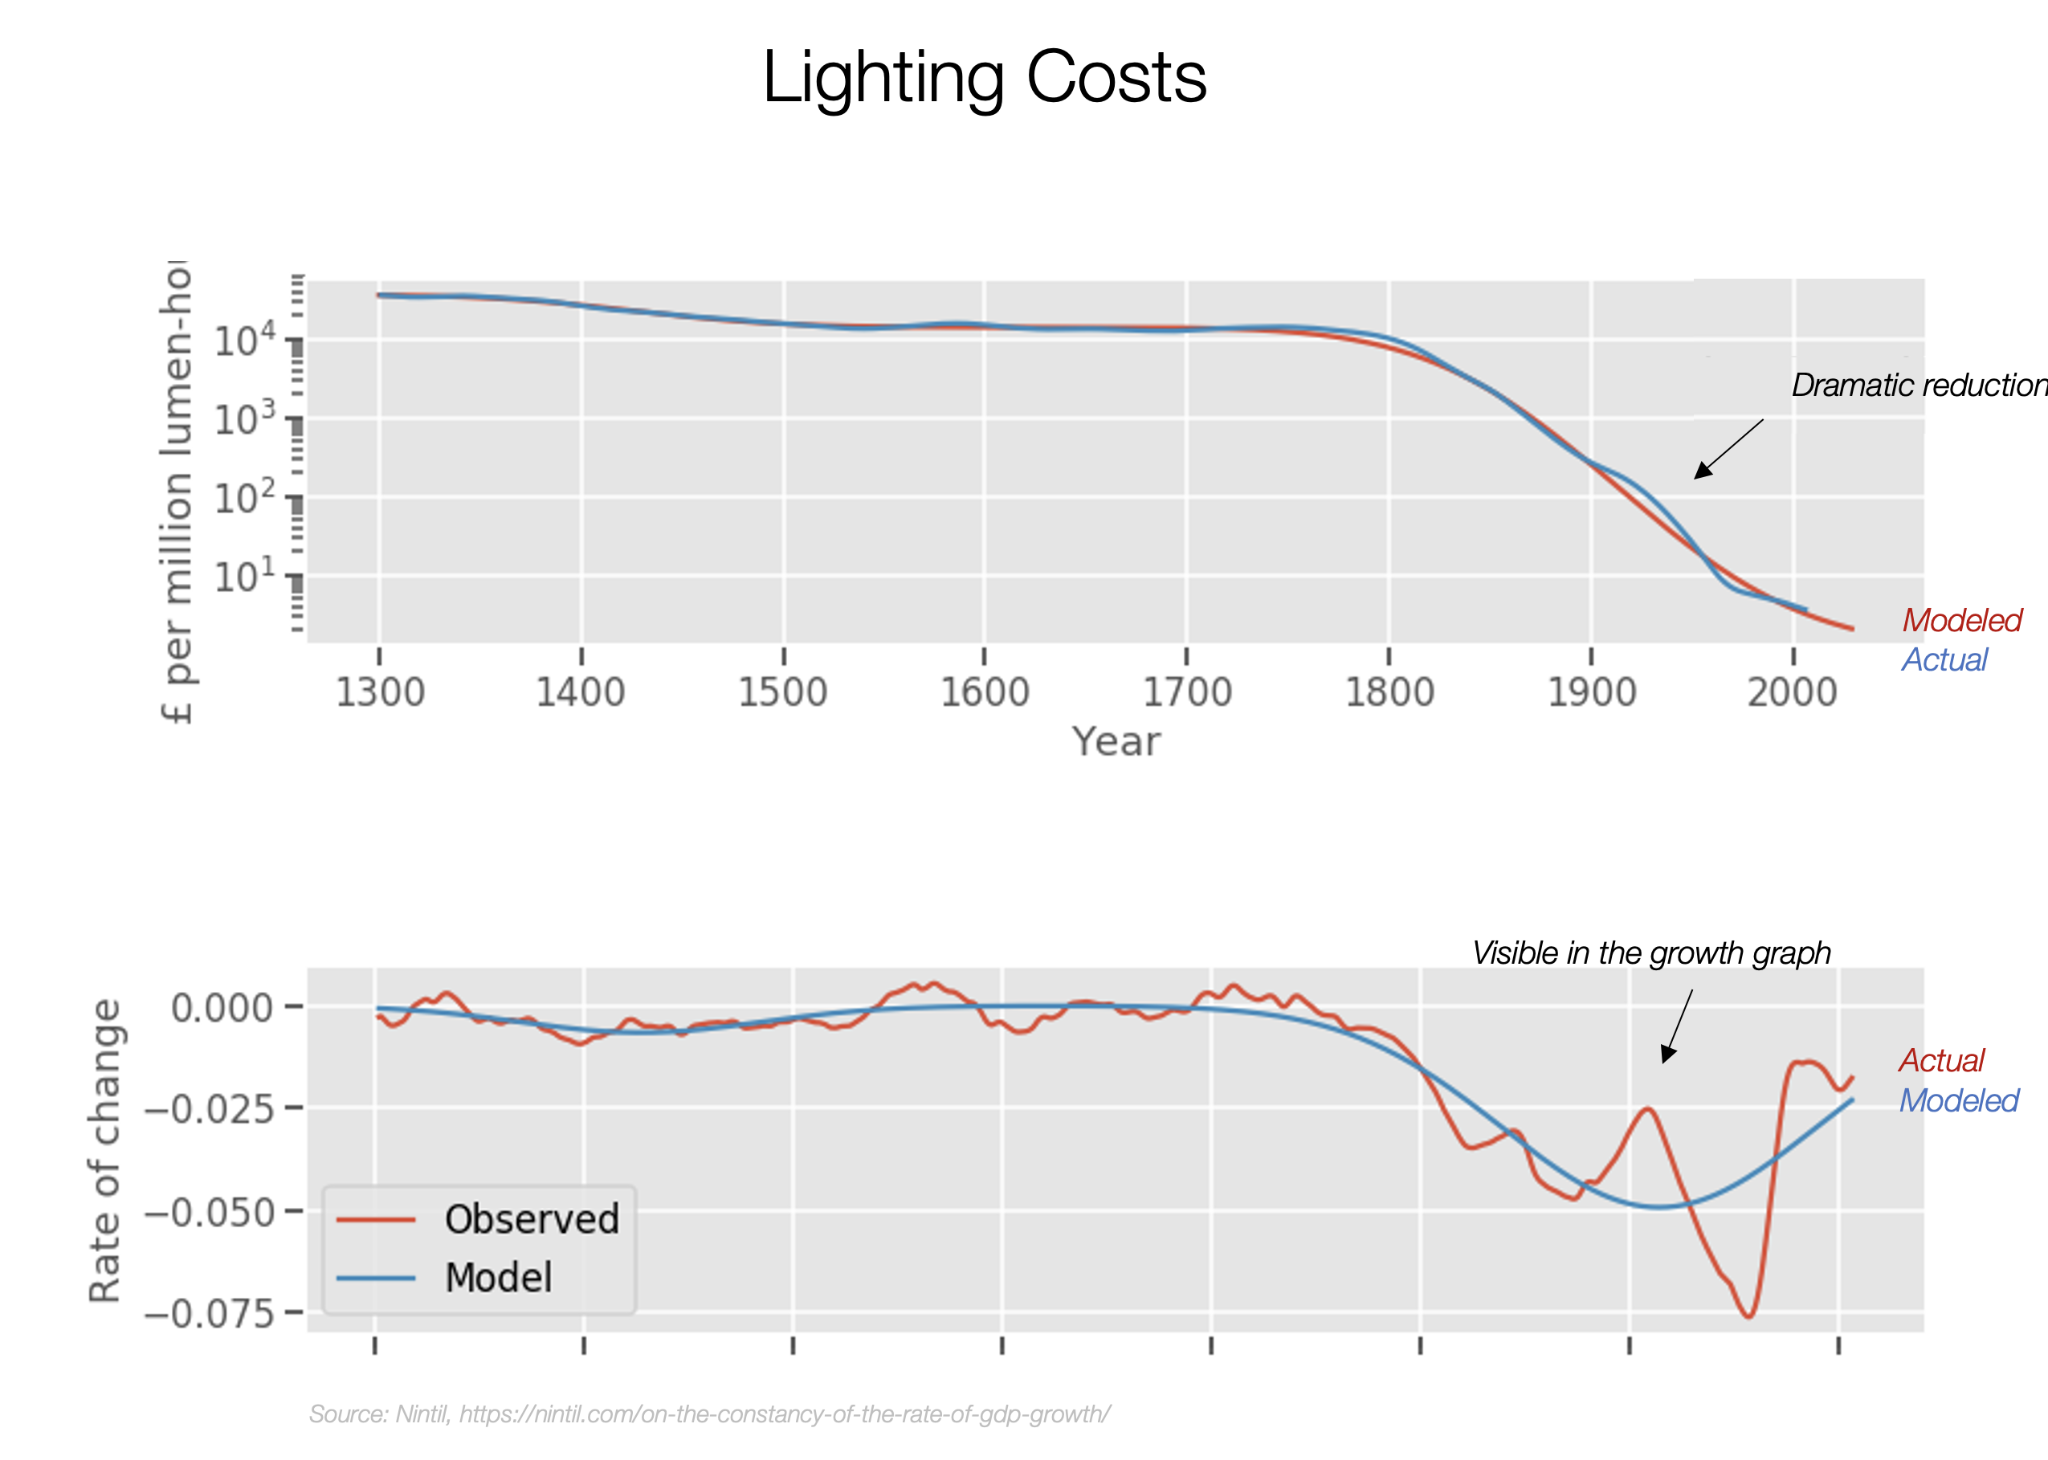
And today we’re still living through many of these, such as Moore’s Law of transistor reduction cost or all aspects of energy.
The hypothesis is that these bursts of productivity improvement happen across industries, because many of these revolutions trigger other revolutions in other fields. If that was the case, you’d see exactly the type of mountain of growth we’re seeing today.
This doesn’t explain, however, why productivity growth in the last few decades is slower and has less variance.
Limits of Productivity Growth
A typical reason why the growth of something slows down at the same time as its variance is because that thing is now more conservative. We see it in older companies, who tend to grow more slowly but are more reliable in their growth.
If this was true of the US economy, what could be producing this?
We spent the 19th and the 20th century basically automating one job: farming. Freeing up all these hands for so long allowed the worker base to grow in other industries.
It’s harder to do that now. The jobs that employ lots of people tend to be those facing the public, for which there’s much more reluctance to automate — or they are jobs which are simply too hard to automate.

All these industries that are highly labor-intensive don’t improve their productivity so easily. Baumol’s cost disease means the costs of these industries skyrocket.
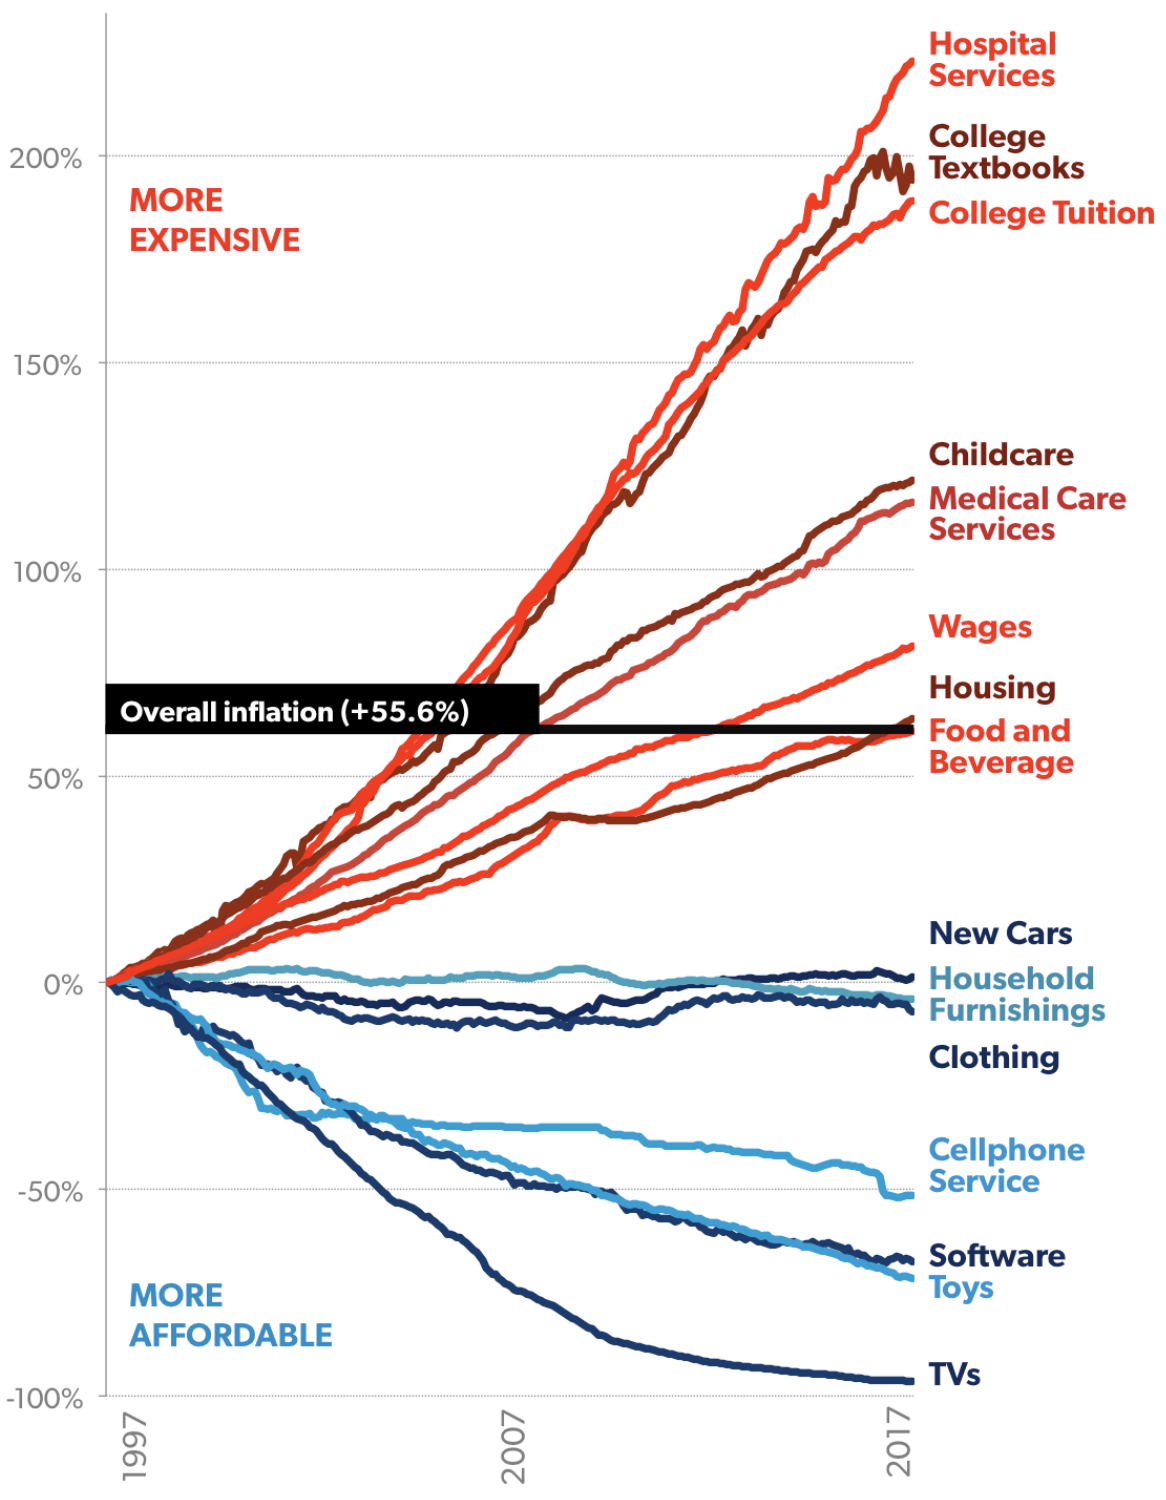
This chart is from the AEI and in turn based on BLS data.
On top of that, many of these industries are highly regulated, which makes innovation harder.
These increases in costs are obvious in industries such as childcare and healthcare. And then for housing—which takes the lion’s share of people’s spending—there’s the additional issue that land is finite.
If all of this is true, what would it take for us to get back to higher productivity growth?
• Less regulation.
• Technological breakthroughs that can enable completely new industries.
I believe the next few decades will give us both of these.
The reduction in regulation would be a logical consequence of the end of nation-states, since more states would mean more variability, and more examples of what works and what doesn’t.
As for technological breakthroughs, it looks like we have one already — artificial intelligence, which might be able to automate a large chunk of the red jobs in the penultimate graph, and we might soon have another one in fusion. That’s without considering all the interesting technologies that are coming: solar, batteries geothermal, cheaper space launching, mRNA, genetic engineering, aging research, blockchain…
I’m sure I’ve missed some things here, so please let me know if you disagree and why in the comments.
5. Optimism for the Future
In our day-to-day lives, we don’t see these trends, since they span centuries. So it’s easy to miss them. But every now and then, we should raise our heads and look at the brilliant future in front of us.

What has happened to human wealth and well-being is astonishing. We’re living in truly unprecedented times. Most of the experiences that people have had in the past were ones of complete stagnation. We take improvement as a given, and we just wonder ”why not faster!?”
But it is faster.
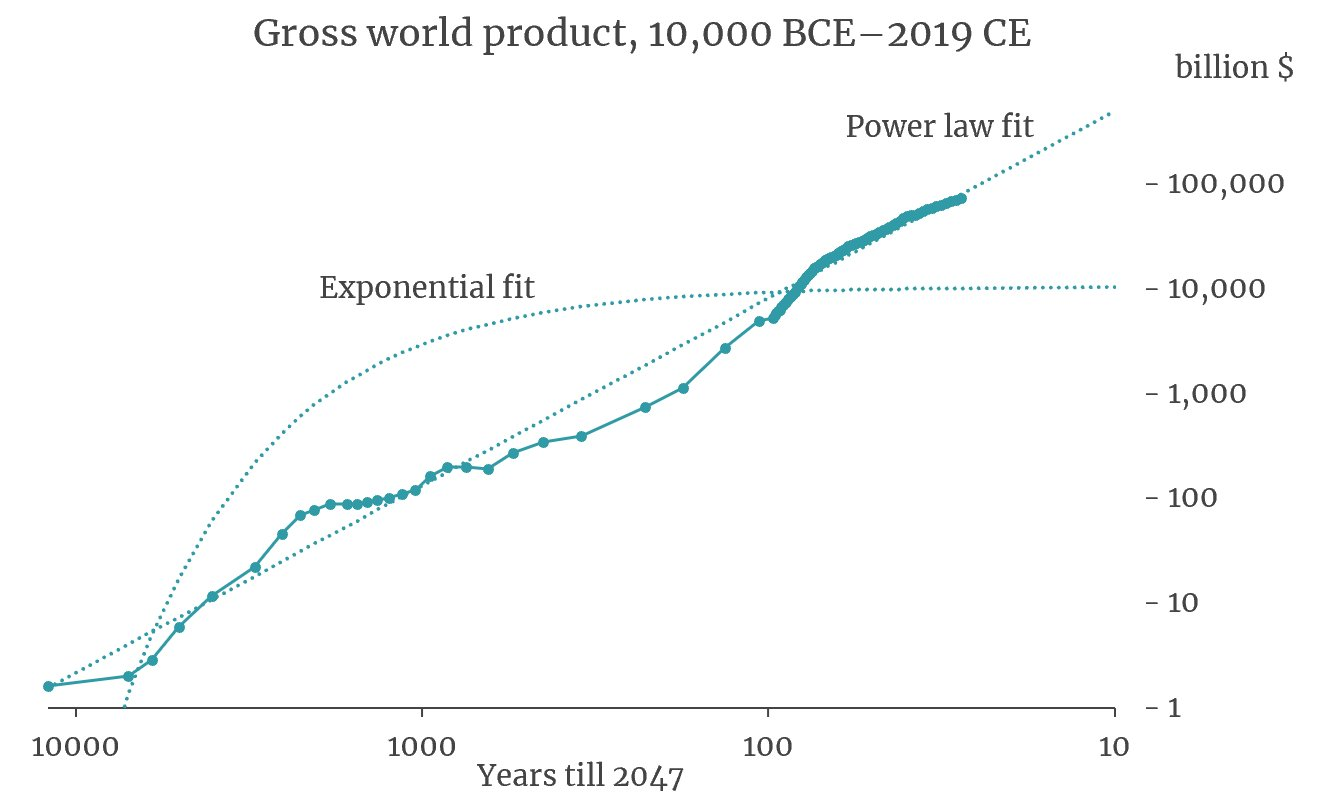
We're creating exponential wealth... exponentially fast! It took us the last ~1000 years to grow our wealth by 50x, from $100 B to ~$5,000 B. It only took us ~100 years to 1000x our wealth. The 21st C will get crazier and crazier.4 ō
FOOTNOTES
1 Early in the pandemic, many people criticized that I compared countries by their total cases instead of their cases per capita. My response was: “I’m trying to assess how much of an outbreak there is in every country. For that, I need absolute numbers. I will use per capita numbers when I compare these countries’ performance.” This is a bit like that.
2 it’s not easier to understand GDP than GDP per capita.
3 In general, if you want to go deep into any given topic, if it’s been covered in Nintil, then you should start there. It’s quite a th orough, intelligent review of everything on the topic.
4 I am very conscious of the sustainability debate, both in terms of climate change, inequality, and mass extinctions. I’m breaking down the problem. This article focuses on the benefits. We’ll talk more about the problems.

TOMAS PUEYO is a 39 year-old Spaniard who studied at Stanford, lives in San Francisco, and earns his living running strategy for a company called Course Hero. He publishes online at Uncharted Territories which, like us, you can become a member of and be kept up to date on his dogged work illuminating serious queries.
Add new comment